The World’s Fastest-Growing Arms Exporters

Saying a country’s arms exports “grew fast” is not the same as saying it is a top exporter — it only means the rate of change between two periods was high. SIPRI’s Arms Transfers Database, updated on 9 March 2026, tracks the change in export volume of 66 supplier states between 2016-20 and 2021-25. This file ranks the 25 largest suppliers by that rate of change — a different axis from the “biggest exporters” ranking (absolute market share) covered in a separate file in this series.
Methodology: what does “fast growth” measure?
SIPRI measures the volume of arms transfers not in dollars but in its own trend-indicator value (TIV), a standardised unit representing a weapon system’s military capability rather than its production cost. Because annual figures fluctuate, SIPRI presents data in five-year periods. The “percentage change” figures in this file describe the change in a country’s total TIV volume between 2016-20 and 2021-25 — not dollar revenue, contract size, or unit programme cost.
| Data type | What it measures | Where it’s used here |
|---|---|---|
| TIV percentage change | Volume increase/decrease between two 5-year periods | Main table, second and third axis |
| Global market share (%) | A country’s share of total exports | Share columns in every table |
| Import growth (TIV) | Change in a recipient country’s import volume | Demand-side data in the “Why” section |
The 10 Fastest-Growing Arms Exporters (2016-20 → 2021-25)
| Rank | Country | 2016-20 share | 2021-25 share | Change |
|---|---|---|---|---|
| 1 | Norway | 0,2% | 1,0% | +349,0% |
| 2 | Belgium | 0,1% | 0,3% | +270,0% |
| 3 | Italy | 2,2% | 5,1% | +157,0% |
| 4 | Türkiye | 0,9% | 1,8% | +122,0% |
| 5 | Canada | 0,4% | 0,7% | +82,0% |
| 6 | Czechia | 0,3% | 0,4% | +62,0% |
| 7 | Sweden | 0,6% | 0,9% | +58,0% |
| 8 | Israel | 3,1% | 4,4% | +56,0% |
| 9 | United States | 36,0% | 42,0% | +27,0% |
| 10 | South Korea | 2,6% | 3,0% | +24,0% |
Winners and Losers Among the 10 Largest Suppliers
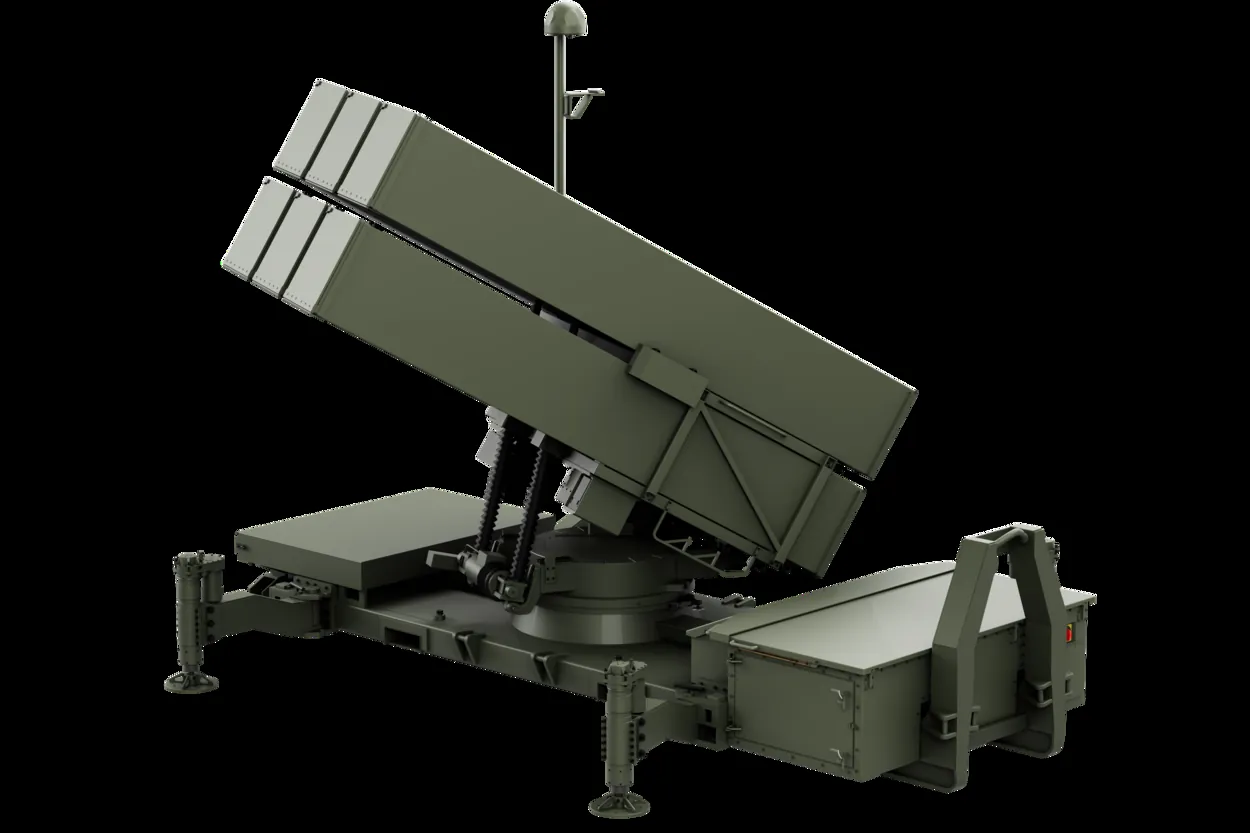
The list above highlights small-to-mid-sized suppliers. But the more striking picture emerges among the world’s own top 10 arms exporters: while US, French, German and Chinese exports grew, Italy and Israel grew far faster — and Russia was the only one of the ten whose exports fell.
| Country | 2021-25 share | 2016-20 share | Change |
|---|---|---|---|
| United States | 42,0% | 36,0% | +27,0% |
| France | 9,8% | 8,8% | +21,0% |
| Russia | 6,8% | 21,0% | -64,0% |
| Germany | 5,7% | 5,4% | +15,0% |
| China | 5,6% | 5,5% | +11,0% |
| Italy | 5,1% | 2,2% | +157,0% |
| Israel | 4,4% | 3,1% | +56,0% |
| United Kingdom | 3,4% | 3,3% | +13,0% |
| South Korea | 3,0% | 2,6% | +24,0% |
| Spain | 2,3% | 2,4% | +6,7% |
The Fastest-Declining Exporters
Growth has a mirror image: when one country’s market share rises, part of that gain can come from another country’s loss. Seven of SIPRI’s 25 largest suppliers saw exports decline, led by Russia, whose exports mostly went to India, China and Belarus. Russia’s fall was driven largely by a sharp drop in deliveries to Algeria, China and Egypt.
| Country | 2016-20 share | 2021-25 share | Change |
|---|---|---|---|
| Ukraine | 1,0% | 0,3% | -66,0% |
| Russia | 21,0% | 6,8% | -64,0% |
| Switzerland | 0,7% | 0,3% | -51,0% |
| Australia | 0,6% | 0,3% | -44,0% |
| Netherlands | 2,1% | 1,2% | -34,0% |
| Brazil | 0,3% | 0,3% | -9,3% |
| South Africa | 0,4% | 0,4% | -7,2% |
Why Did These Countries Grow So Fast?
Europe’s rearmament
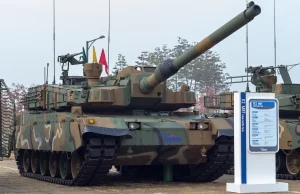
Combined arms imports by the 29 current European NATO states rose 143% between 2016-20 and 2021-25, with 58% coming from the USA. The remaining demand spread to suppliers such as South Korea (8.6%), Israel (7.7%) and France (7.4%). Poland’s 852% import surge is the main reason South Korea appears in this list.
The Gulf’s arms build-up
Qatar’s imports rose 106%, Kuwait’s 805%. Italy sends 26% of its exports to Qatar and 17% to Kuwait — a large share of Italy’s 157% growth is fed by this demand. Norway’s main buyers, by contrast, are the USA (33%), Ukraine (22%) and Romania (16%), tying its growth more closely to Europe’s response to the Russian threat.
Russia’s lost market share
Russia’s exports fell 64%, driven mainly by steep declines in deliveries to Algeria, China and Egypt. Some of that demand shifted to other suppliers, including Czechia and Sweden.
Demand for air defence and UAVs
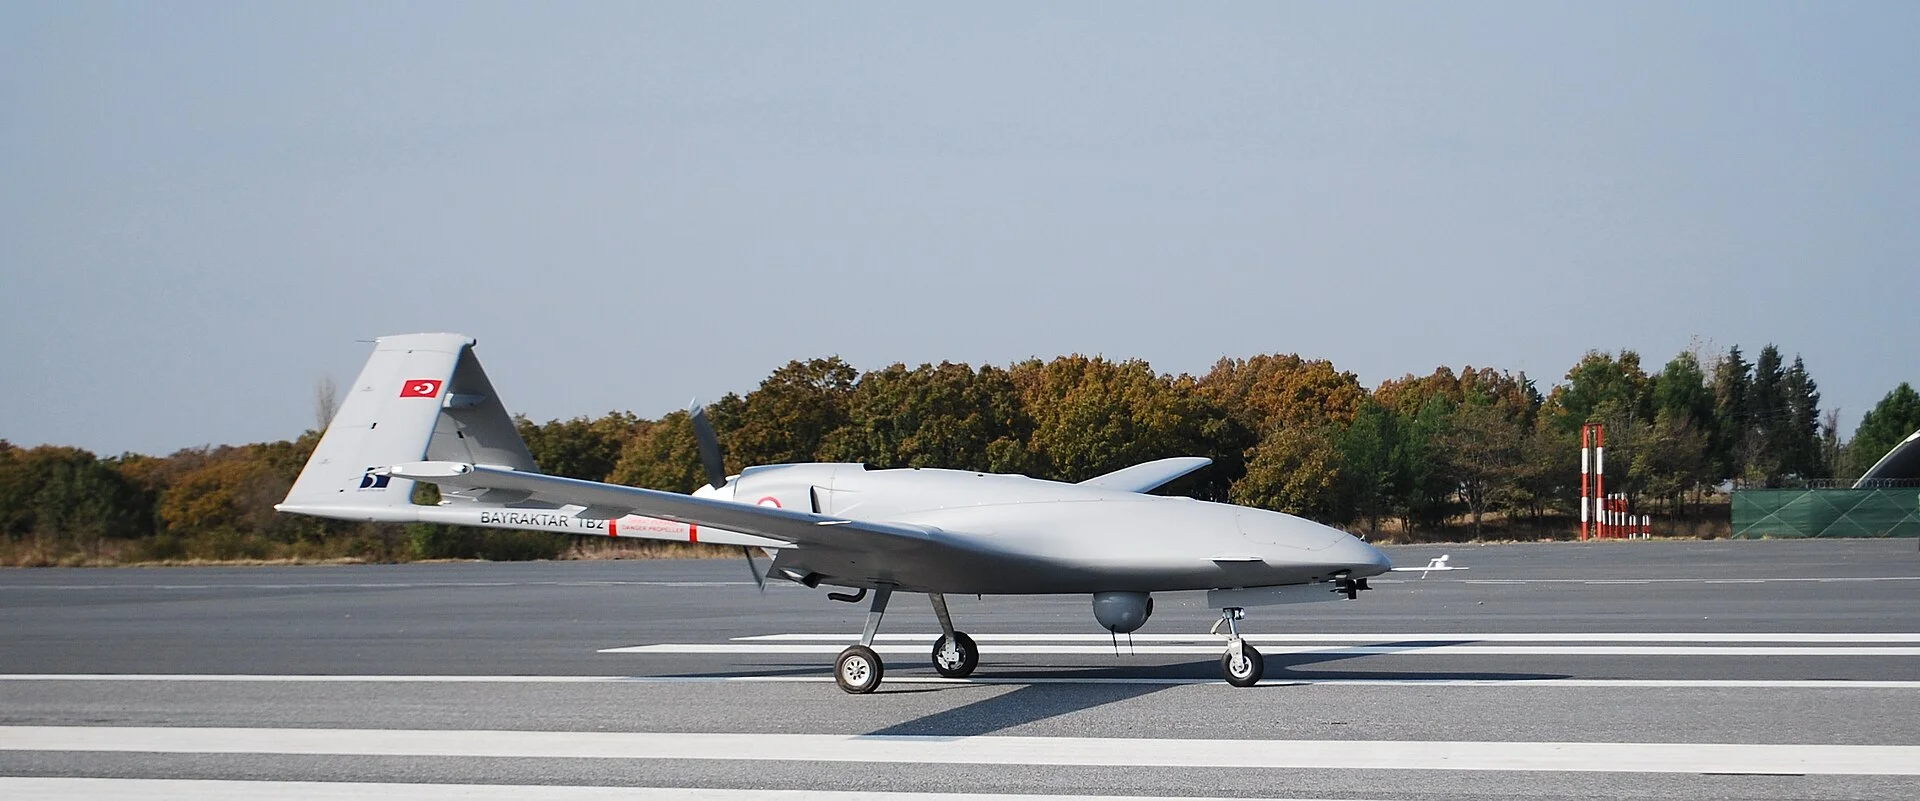
Per SIPRI, Israel’s 56% growth rests on production of air defence systems facing high global demand. Türkiye’s 122% growth largely tracks the expansion of its UAV exports (see this series’ file on exported military UAVs).
Türkiye: 4th-Fastest Among the 25 Largest Suppliers
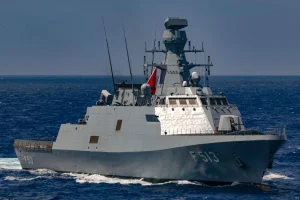
Per SIPRI, Türkiye’s share of global arms exports rose from 0.9% in 2016-20 to 1.8% in 2021-25 — a 122% increase. That makes Türkiye (once Iran is excluded) the 4th-fastest-growing country among the 25 largest suppliers, just behind Italy (157%) and ahead of Canada (82%). Türkiye’s main 2021-25 buyers were Pakistan (16%), the UAE (12%) and Ukraine (8.4%); in sub-Saharan Africa it was also the third-largest supplier with an 11% share.

Per Baykar, the Bayraktar TB2 alone has been exported to 36 countries — evidence that Türkiye’s growth spans a broad export base, from UAVs to armoured vehicles, rather than a single product line.
Frequently Asked Questions
Which country grew its arms exports the fastest?
Where does Türkiye rank?
Where does this data come from?
Why do some countries show percentage increases in the thousands?
Is the fastest-growing exporter the same as the biggest exporter?
Why did Russia’s share fall so much?
Sources
- SIPRI, “Trends in International Arms Transfers, 2025”, SIPRI Fact Sheet, March 2026 — sipri.org
- SIPRI Arms Transfers Database, updated 9 March 2026